web 2.0
From Consumers to Creators: Infographics in Social Studies

We are an information saturated society.
Information, data, and facts stream through our consciousness at surprising rates. Our students have been raised on Google with its instantaneous access to information 24/7. Immediate access, however, does not mean that our students (and most adults) have the skills and habits of mind to process that information, seek patterns, make sense, identify problems, and create solutions.
At TCEA in February, I wanted to attend a session on using infographics in Social Studies, but I ran out of time (too much to see…). I’ve dabbled with creating infographics myself for the purpose of publicizing the library’s statistics and information, but I had yet to try having students create them to demonstrate learning. I was unable to attend the session, but I was able to locate some terrific sources to help me wrap my head around how students can re-mix information and data in a visual, graphic format.
Through my Google search, I found several terrific boards on Pinterest with infographics for social studies. But, with the exception of a handful of teacher blogs, I struggled to find resources for engaging my students in an inquiry process for the purpose of creating their own infographics. Luckily, I came across Kathy Schrock’s Google Site, which provides how-to videos, rubrics, examples, and websites for creating infographics. Now all I needed was a willing teacher and a batch of curious students.
Thank goodness for professional relationships. Wednesday, I blogged about one such relationship with my Math department chair. Luckily, I had a similar relationship with a US History teacher founded on trust and like-mindedness. “Marty McFly” (he chose his own pseudonym) teaches English and US History, and so he brings with him his experiences with inquiry, research, and literacy to his social studies classes. “Marty” is also passionate about engaging his students in higher-level questioning, inquiry, and thinking in regards to his curriculum. And, he’s comfortable with experimentation when the outcome is not easily known.
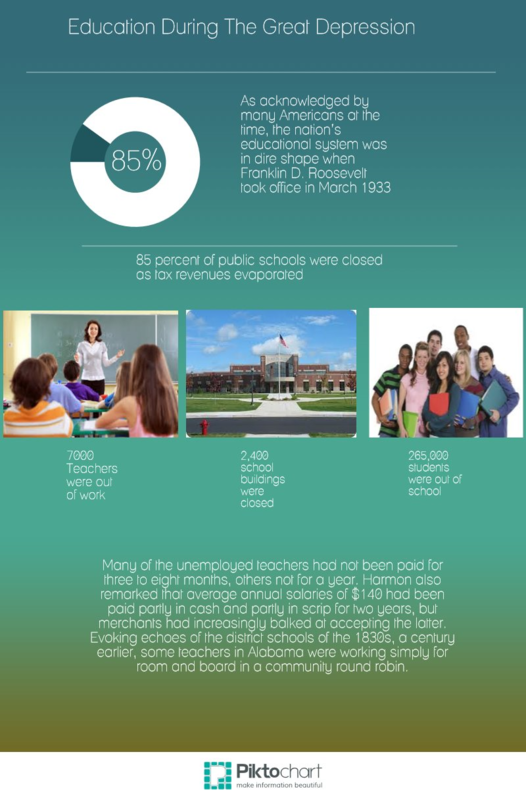
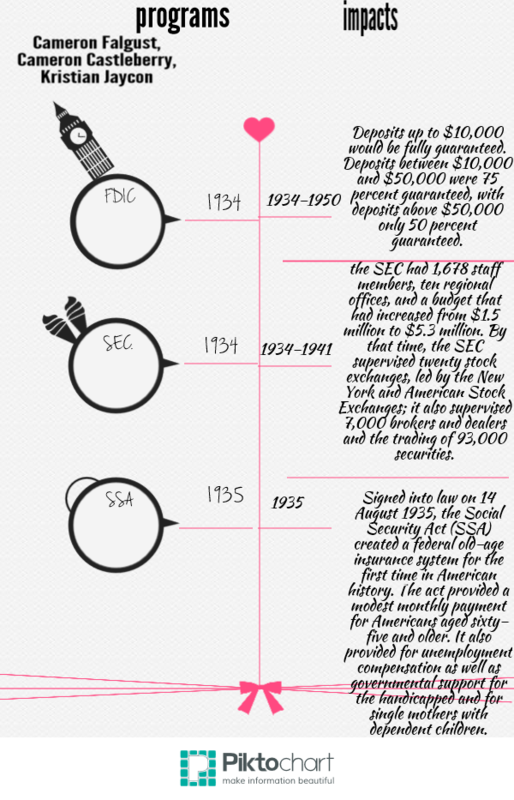
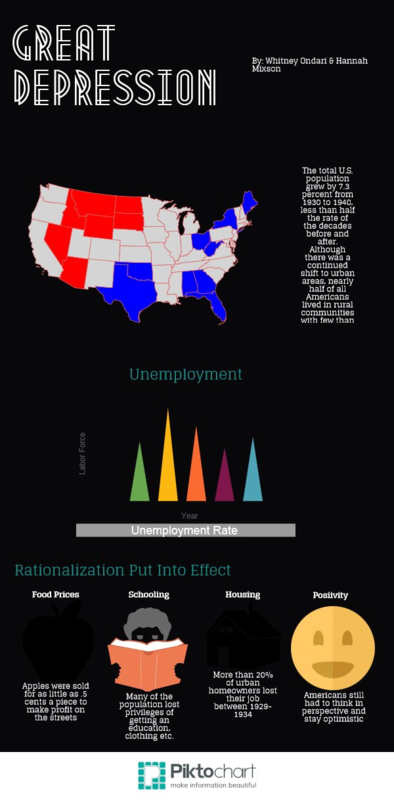
We began planning by identifying the content-specific objectives and learning outcomes. Students were wrapping-up their exploration of the Great Depression and New Deal and were preparing for the unit test. In addition to the time period objectives, “Marty” also wanted to address some of the process and critical thinking skills in the US History TEKS:
(A) create thematic maps, graphs, and charts representing various aspects of the United States; and
(B) pose and answer questions about geographic distributions and patterns shown on maps, graphs, charts, and available databases.
We agreed that students could demonstrate their understanding about an issue or topic relating to the unit AND satisfy these performance standards by having them work in small groups to create an infographic that seeks to answer a question.
Whenever I work with students with inquiry (which is ALWAYS), I begin by thinking about which part of the inquiry process is best to engage them in. I’ve learned that it’s not always developmentally appropriate (or timely) to begin by having them create their own researchable question each and every time. For this project, “Marty” and I decided to create the questions for students since they were driven by specific content needs and formed from the US History TEKS:
Another decision we needed to make was how much direct support to provide to the whole class. Knowing that the infographic creation website was a brand-new tool for them, I struggled between taking the time to stop and walk through the process of creating one with the entire class, or allowing them to be independent problem-solvers and learners. We opted for the latter…(more on that in a moment).
To prepare for classes, I created a Google Doc with all of the directions, links, and resources, which was shared with students through the class Edmodo wall. We began the lesson by asking the question, “How does visualizing data help us understand an issue or topic?”
Using the YouTube video, “Fast Food” from “The Infographics Show” YouTube Channel, I invited students to comment on how the video helped them to remember significant facts about the topic. We made a list of all the ways we saw the creators of the video visualize data (charts, symbols, maps, graphs, etc.)
Next, we analyzed a few different infographics as mentor texts in order to define what they were. Here are some of our favorites:
Walking Debt–inspired by Walking Dead
Once students understood what an infographic was and its basic elements, I began to walk them through their research process beginning with the list of 10 researchable questions. Demonstrating the use of three of our online resources, Student Resources in Context, Gale Virtual Reference Library, and Sharpe Online Reference, I reviewed how to cite sources and take notes electronically in a Google Doc, which they could share with their group members through Drive.
Students spent the next full class period searching for sources with data and information that would help them respond to their researchable questions.
On the third day, students met in their groups to share and compare information, determine which pieces of information they would use and how they would visually represent it, and create a hand-drawn, rough draft of their infographic. (I learned the importance of a rough draft for any digital project from my early days with Digital Storytelling).
Our plan to allow students to be independent learners of the infographic creator sites backfired, when the tutorial videos posted on sites such as Visua.ly and Piktochart were blocked by our school filter (…..yep, I should know better by now…). So, we ended up spending about 10 minutes on the final day walking them through the process of creating an infographic in Piktochart.
List of Infographic creation websites:
We discovered that students needed more time to synthesize the information and create the infographic than originally planned, which ties back to our original reflection on teens as information consumers that they are so used to consuming information rather than using it to form new interpretations and solutions.
“Marty” had some interesting thoughts relating to the gap between students who successfully completed the assignment and those who really struggled,
I think this demonstrates Piaget’s theory that not all people reach the formal operational stage. Those that I knew would understand did, and those I knew who wouldn’t understand didn’t. Those that didn’t I think would need someone to walk them through step-by-step in order for them to create something we would say was a good product.
That “Marty McFly” is one smart guy…
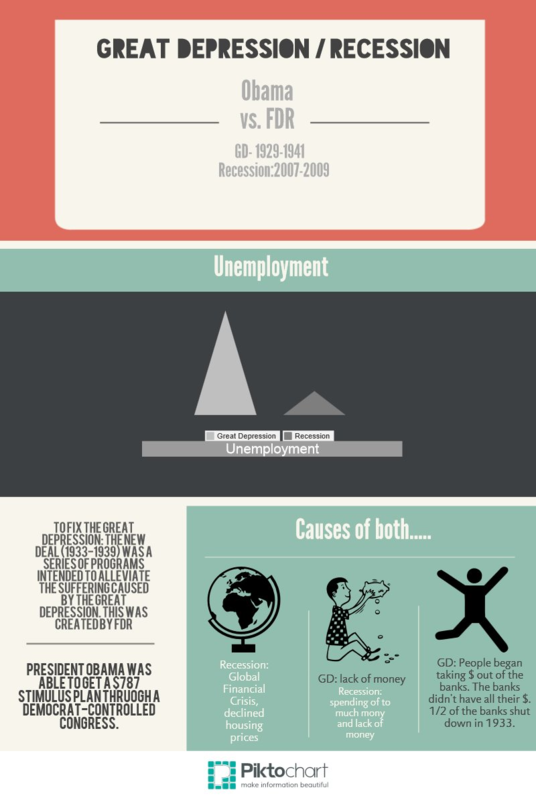
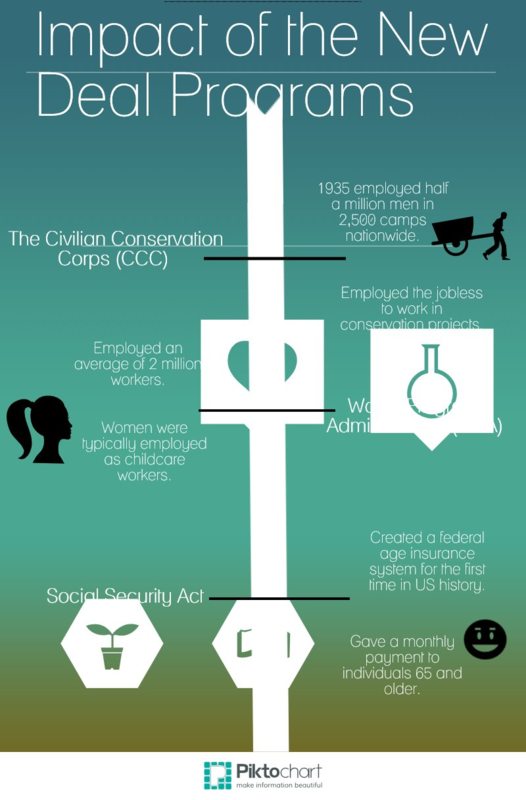
Overall, “Marty” felt that the project, “gave [students] a better look at numbers (people affected, money lost, money needed to formulate programs, etc.) so it helped them understand the enormity of the situation…it helped them learn the different New Deal programs better. It also helped them see the parallels of the recent recession.”
We both agree that had we chosen one website like Piktochart, demonstrated for all students the basic features they need to create the infographic, and provided more support and modeling of the keyword searches for various questions, then we would have seen greater completion and better products.

Looking at the final infographics, I have to say that I am impressed with most groups’ ability to synthesize that amount of information, identify a clear message for their graphic, and use visuals to convey that message. I do still see many who relied heavily upon text rather than images, which I find curious. Perhaps that can be addressed in the planning phase next time. I’d also like to include a mini-lesson on utilizing the images and primary documents available in our electronic collection and Creative Commons images to add another layer of content to the infographics.
My greatest take-away from this experience is that we need to have students locating and re-mixing information in various formats for the purpose of creating new solutions and messages. By learning to manipulate and represent information for a given audience, they will learn to be more discerning of the information that courses through their daily lives rather than being mass consumers.
Student Samples:
Experiential Learning in Algebra I: The QR Code Experiment
The librarian went to Algebra I class today, and I learned so much! Not only am I now solid on identifying inequalities on the coordinate plane, but I also understand much more about the importance of technology tools applied in authentic learning experiences.
As the campus Library Media Specialist, I am extremely lucky to have such powerful professional and personal relationships with faculty across all content areas. Technology integration is scary and make-me-want-to-pull-my-hair-out frustrating at times. Our professional relationships are an integral lifeline when seeking to innovate any instructional context–but especially when integrating technology.
Our principal began the year with three very specific instructional expectations for our campus:
1) Engage students in learning.
2) Seek to integrate technology in instruction.
3) Design lessons using the VESTED format (a sheltered instructional model developed by the Kolak Group)
As a campus and as individual teams we’ve faced many obstacles to meeting these goals–especially with technology integration. These barriers seem to stem–ironically– from technology, in particular our infrastructure’s capacity to support wireless connectivity for 30+ devices in a classroom and our very tightly-woven internet filtering software. When faced with these barriers, many teachers understandably quit. Those who are adaptive and responsive to these barriers, often find the support and creative solutions they need to innovate instruction through professional relationships and collaboration.
One such collaboration that has taught me tremendously has been with our Math Department Chair and Coach. Wendi and I share a platform of trust, which is paramount in any professional relationship. She and I also share like-mindedness when it comes to engaging students in learning. We have different levels of comfort and experience with technology integration, which allows for a dynamic relationship. I know next to nothing about math and instructional methods for teaching math to teenagers; she feels that she knows next to nothing about using technology when teaching math to teenagers–our collaboration is founded on reciprocal teaching and learning from one another as colleagues.
Wendi’s spark of innovation appeared in one of her own children’s Language Arts assignments that came home one day. The teacher had used QR codes to teach students about synonyms and antonyms. Wendi was so impressed with the basic premise of the assignment and her experience as a parent supporting her young learner through the assignment, that she made immediate connections for adapting it for an upcoming lesson with her Algebra I team.
She showed me the assignment–a simple table with 9 QR codes that linked to a website students used to respond to the prompt. We started by talking about her content goals for her Algebra I studnets first.
Whenever I collaborate with teachers on integrating technology with learning, I ALWAYS start with the content and expected learning outcomes. Integrating technology is not about finding ways to use iPads or QR codes in the classroom, but rather integrating technology is about identifying what tool best supports students’ learning in a given context. (p.s., sometimes the solution has nothing to do with technology!)
Wendi’s goal for her students: Identify inequalities on coordinate planes.
How would students demonstrate this skill to her? By correctly identifying a shaded graph with it’s symbol.
I heartily agreed that QR codes could be an effective tool to support students with these goals.
Wendi worked over a weekend to collect images of shaded graphs, and then we sat together to put the assignment together, which involved troubleshooting certain technological barriers.
Barrier 1: QR codes needed to link to images; however, Google Images as well as photo hosting sites such as Flickr and Tumblr are blocked by our filter. We needed a place to house the photos online that students could access through our network.
Solution: We created a folder in Google Drive, uploaded the images to the folder, changed the sharing permissions for the entire folder so that anyone within the district’s Google domain could access the link, and then used the shared links for the images to create QR codes.
Creating the assignment once we had all the images took about 20 minutes. I then showed Wendi how she could make a copy of the assignment’s Google Doc to use as a template for future assignments, saving her time in the future with formatting.

Wendi shared the assignment through Google Drive with her Algebra I team and scheduled the cart of iPads for each teacher.
We were excited to see how students and teachers responded to the activity.
The day of the assignment, Wendi and one of her teachers came to me with our next unforeseen barrier.
Barrier 2: When using the QR scanner on the iPad with the devices connected to the student wi-fi network, the links were blocked–even though they linked to the district’s own Google Drive (exasperated sigh). Wendi and her teacher could have given up then and there. We had less than 20 minutes to find a solution.
One of the most important traits of a 21st Century teacher and learner is the ability to adapt and problem solve.
Solution: …I may have found a loophole to the wi-fi issue, which I cannot entirely disclose…let’s just say I applied a little creative compliance to find a network solution…
I asked the first teacher to try the activity with students if I could stay and help support her and her students. That way I could be available to trouble shoot anymore barriers or obstacles that may arise. Since we were using the district’s Google Drive domain, it was necessary for one student to log in to Google Drive the first time they scanned a code, which they adapted to very easily.
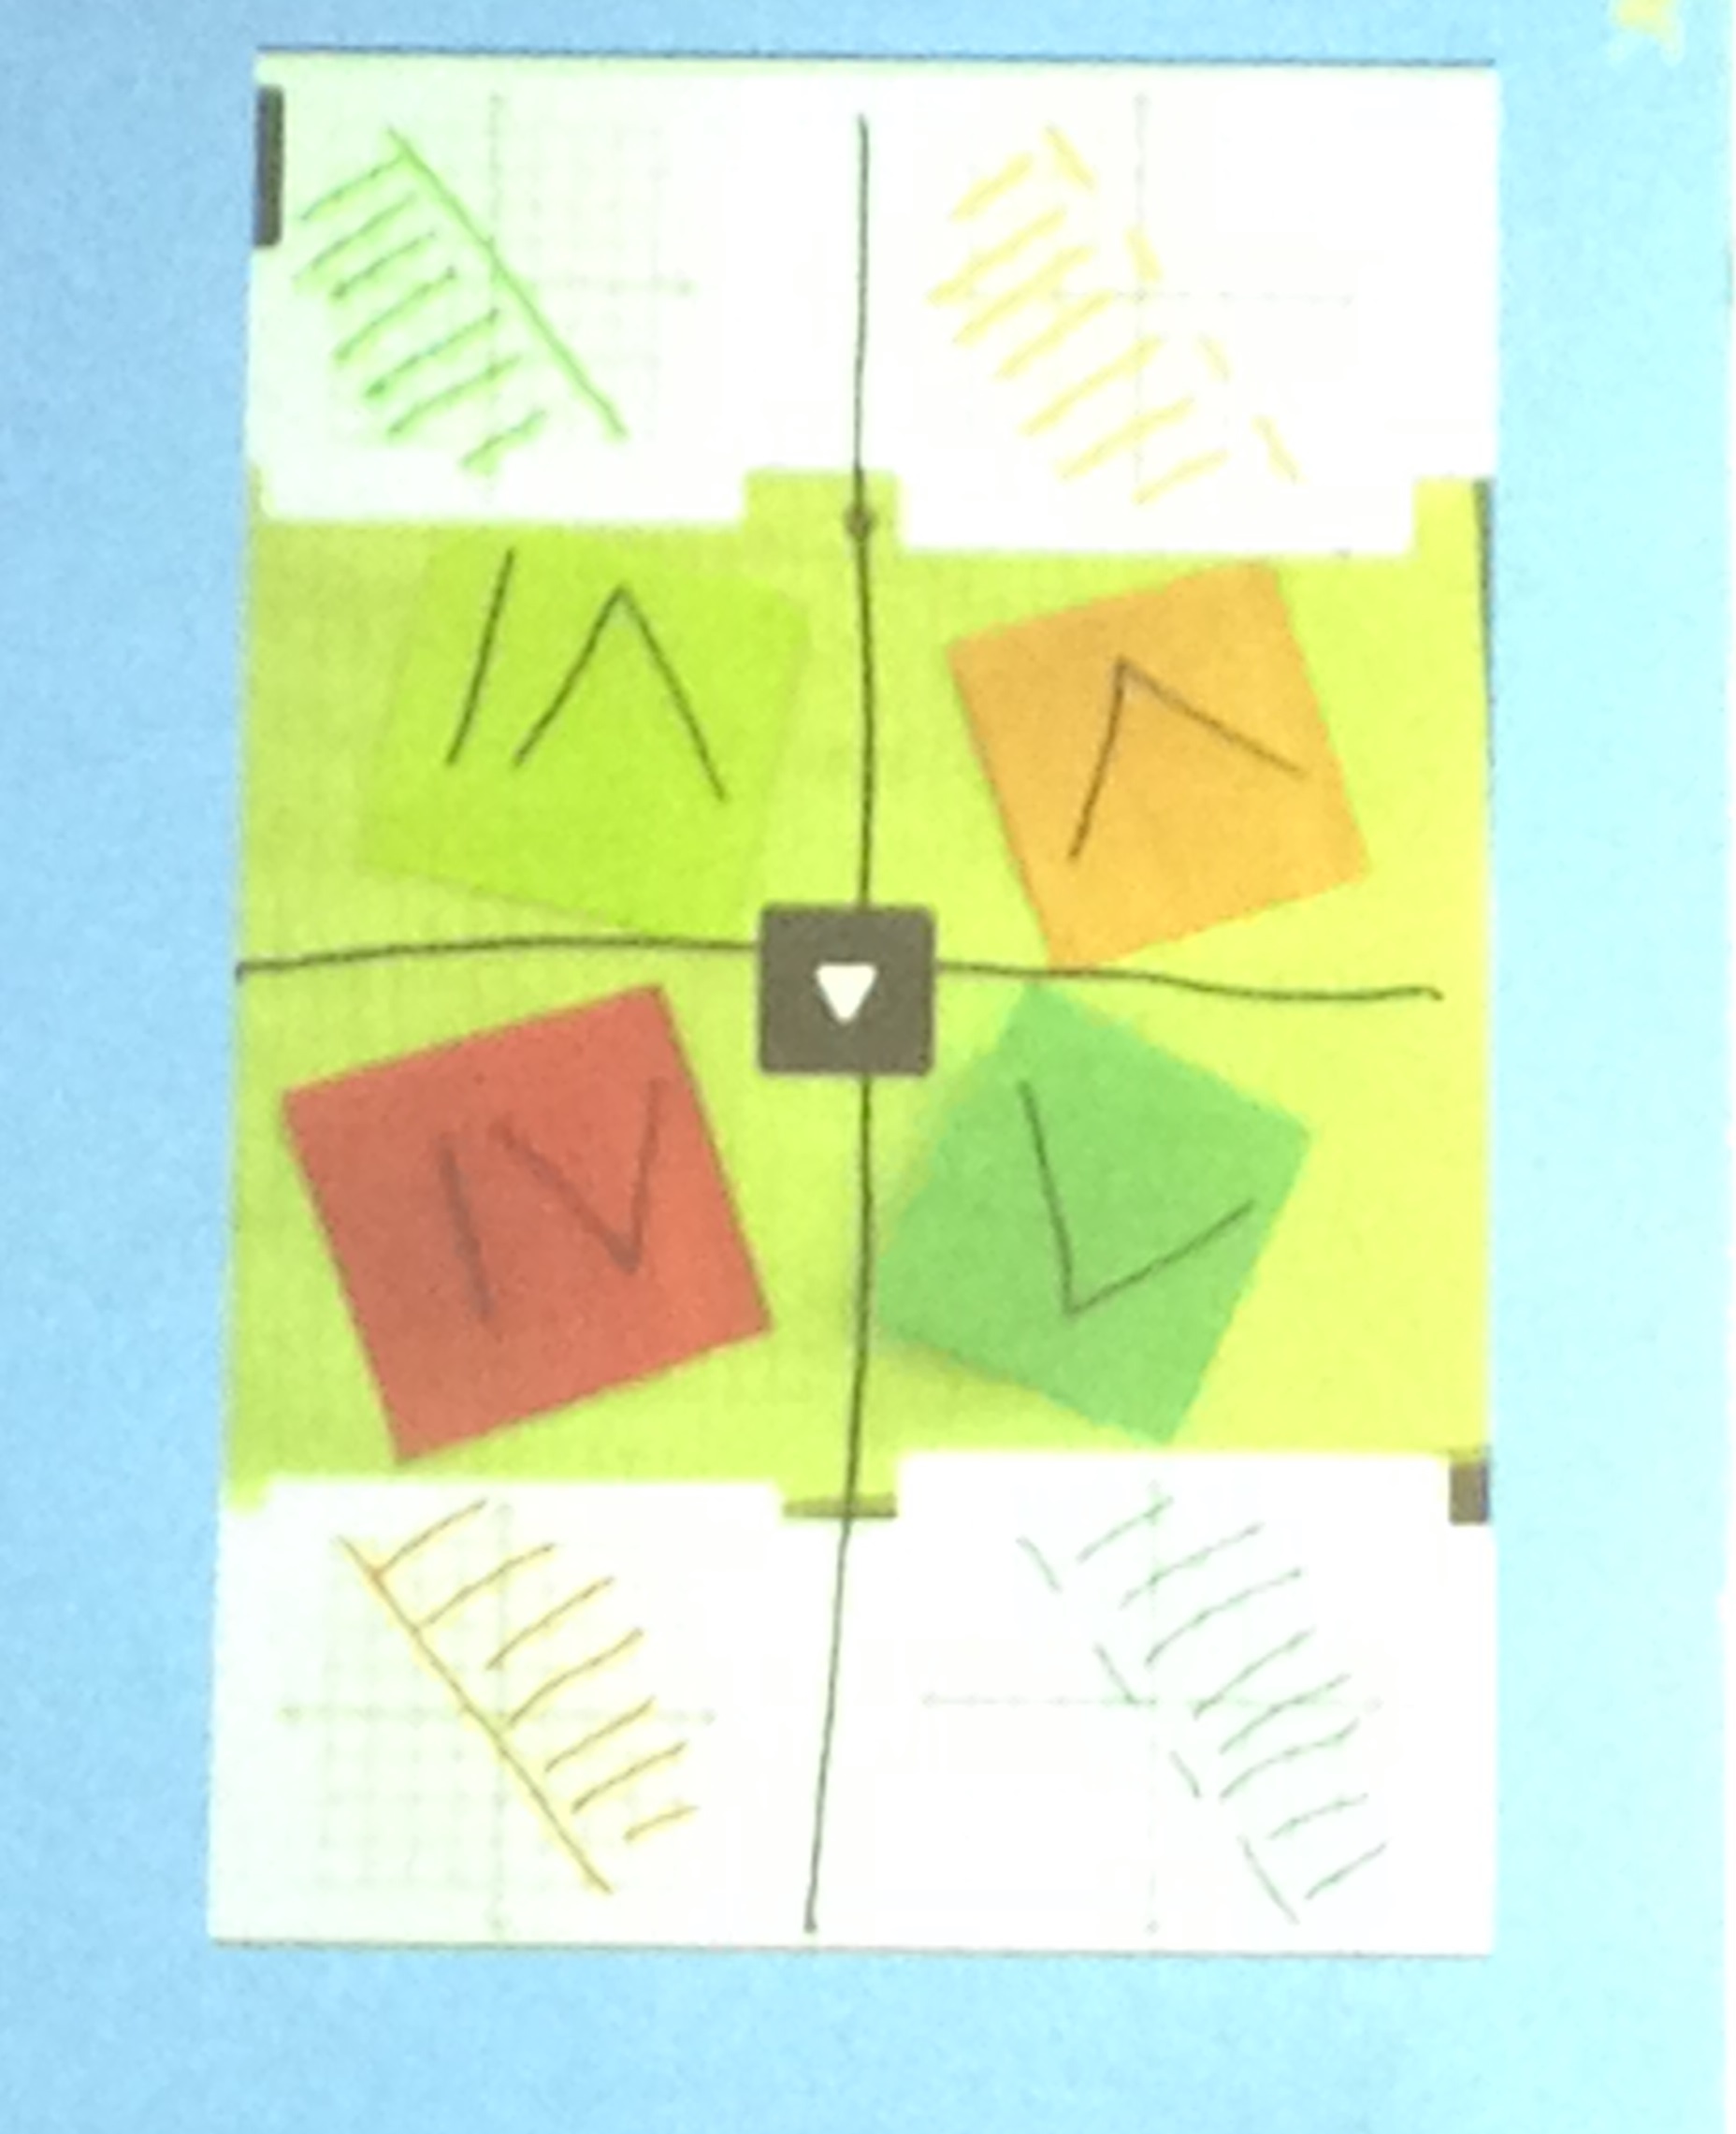
The QR activity followed a quick introduction, which drew upon students’ prior knowledge of inequality symbols. The teacher displayed a visual with four coordinate graphs and their corresponding symbol and asked students to talk to their partner about what they noticed.
As I walked through rows of students observing, I heard responses such as “if you notice where the lines are located …” and “in general, when the shaded area is beneath the line…” By inviting students to note patterns first, the teacher placed the learning experience in the hands of students rather than delivering content knowledge. What I really appreciated about this was how natural it came to students. You could tell by their willingness and openness to share their thinking out loud that this type of discourse was a regular part of their classroom experience.
She then asked them what they noticed, “Why are these two lines dashed and these two solid?” By utilizing higher-level questions to guide them to justify their responses, the teacher drew upon students’ ability to think metacognitively. Learning was happening at higher levels before technology was even introduced.

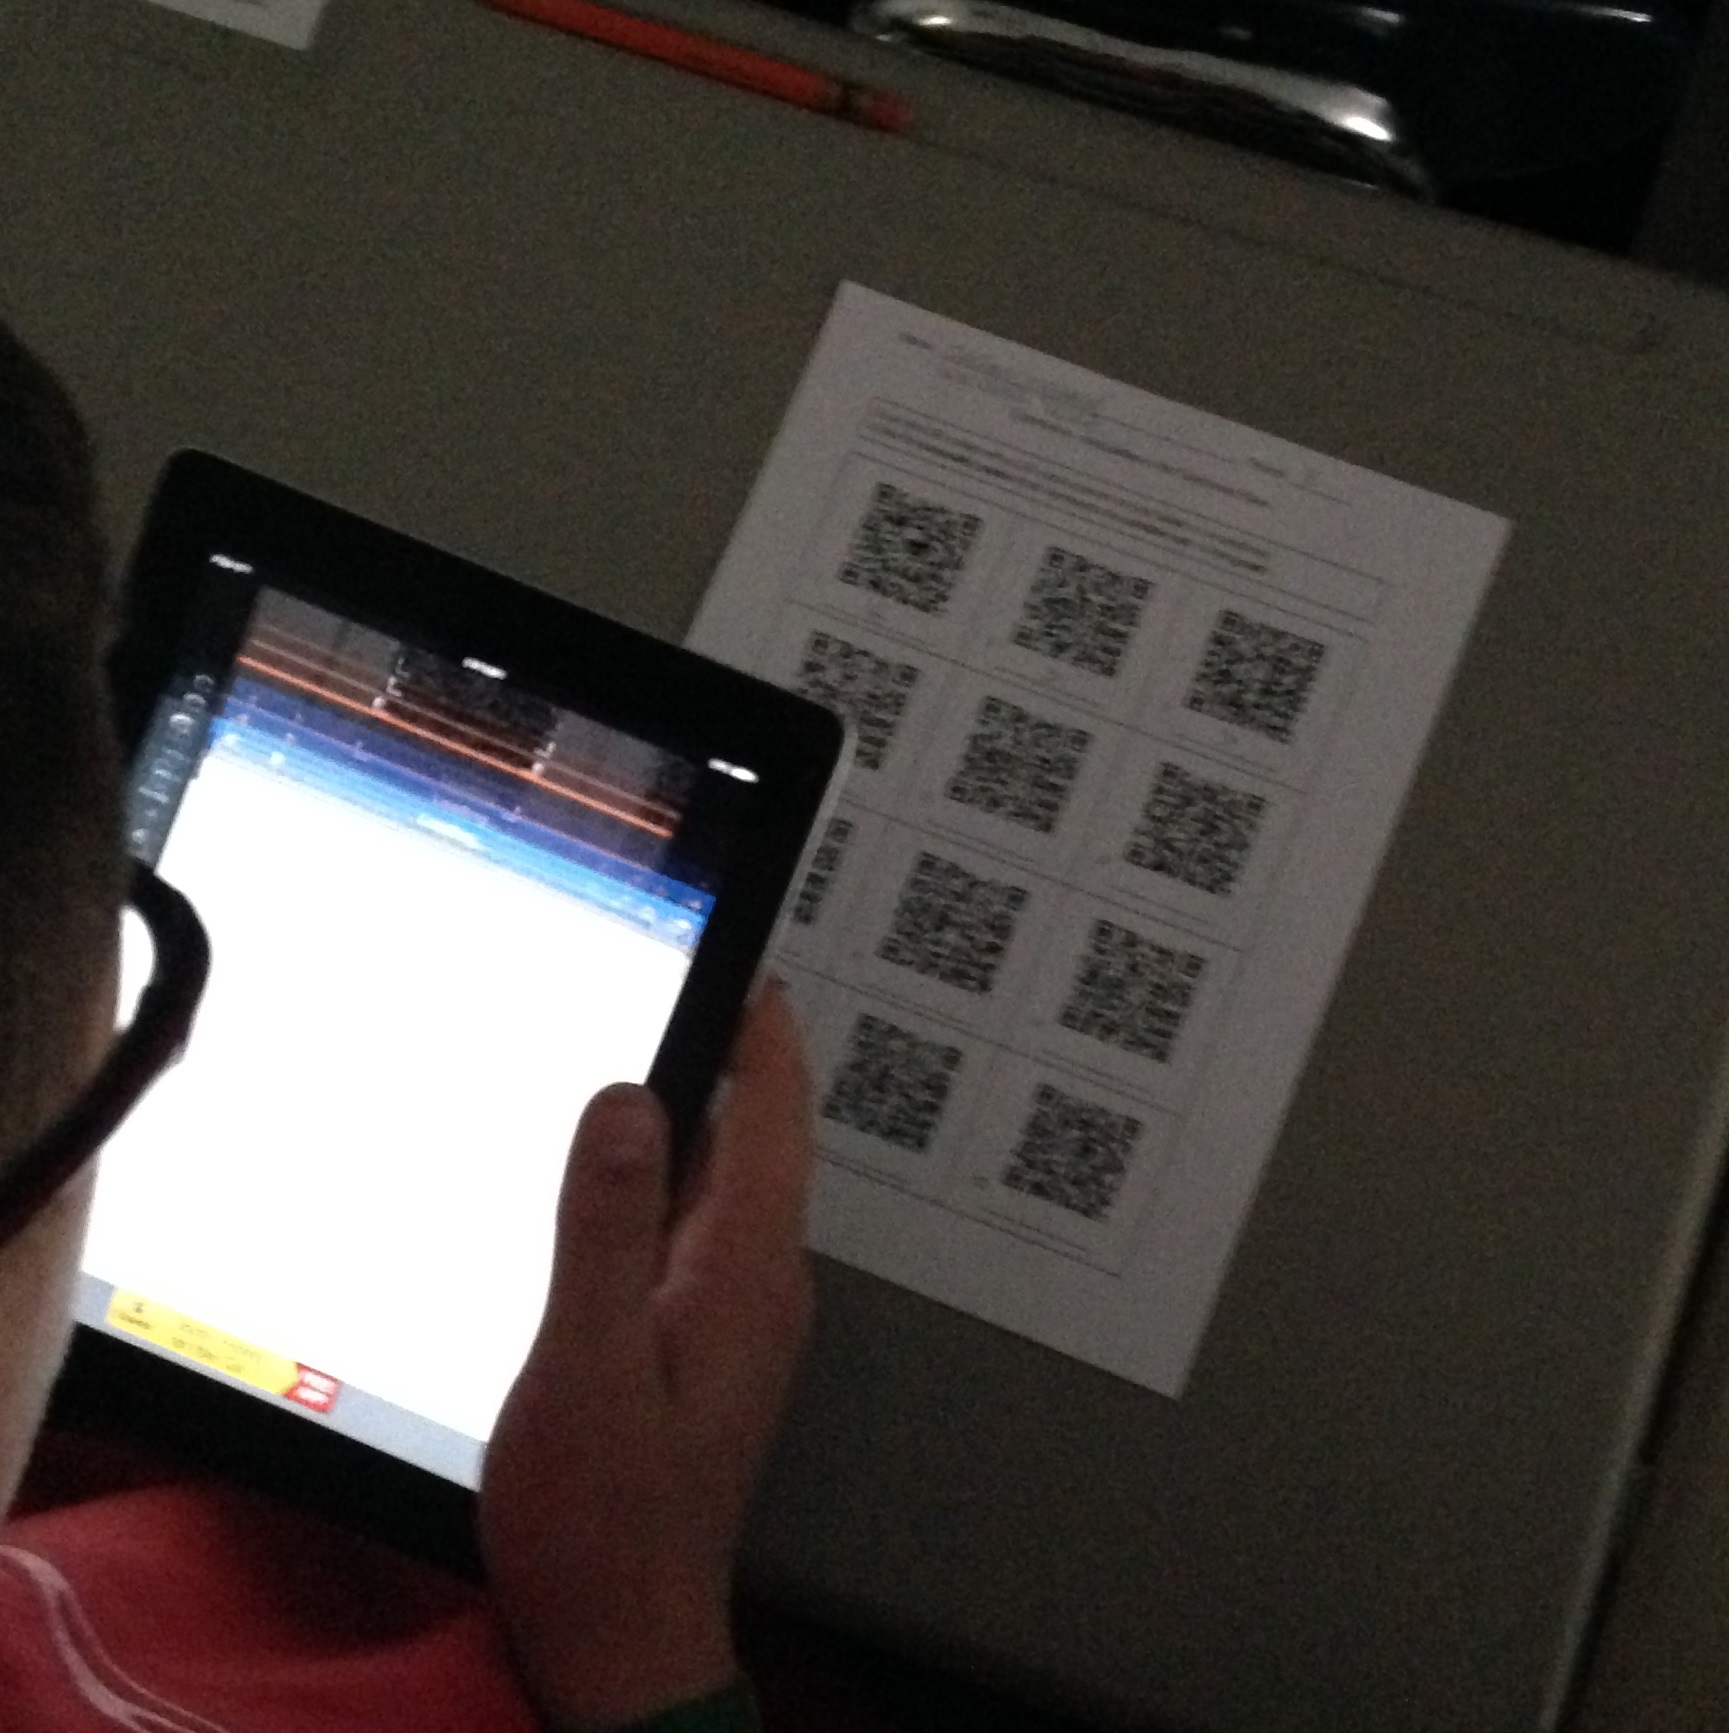
Students then received directions for the QR activity, and I walked them through scanning and identifying the first coordinate graph to ensure all devices were working appropriately and students felt successful using the iPads as a learning device.
The teacher and I walked around, actively supporting students if they had any issues with the QR code or device, and observing students’ conversations with their partners as they scanned and worked together to determine the correct symbol. The initial visual remained on the board for students to use as a key.
All students were engaged in the activity as academic discourse flowed throughout the room. As partners completed the assignment, I reminded them to check to make sure they signed out of Google Drive on the devices and cleared the scanning history in the QR reader app. I chatted informally with groups of students about their reactions to the assignment. All but one student reported that they felt they understood more about inequalities on coordinate planes after using the iPads than if we had provided the images of the graphs on the paper. The one student who didn’t feel this way said that the experience would have been the same for her without the iPads. All students reported that they felt confident in identifying the correct symbol for an inequality and commented on how fun class was that day.

Learning did not stop when the devices were dark. Even when the activity was over, I heard pairs talking about the graphs they had discussed. One pair in particular was pointing to different QR codes, recalling the differences and similarities between the graphs they linked to and the inequality symbol they recorded. Even though the visual was no longer in front of them on the screen, it was painted on their mind because of their experience with the learning task. When looking at a QR code, they still saw the graph it represented.
Without the collaboration of the team, my relationship with Wendi, the Department Chair, and the adaptability and resiliency of the classroom teacher, this lesson may have never been actualized.
How can we ensure that teachers have the collaborative relationships and support they need in order to experiment with new technologies and innovate learning for their students?
Tech Tuesday RETURNS: Writing the Web One Image at a Time
As we continue to make the evolution from Web 2.0 to Web 3.0, I am astounded by the number of excellent creativity tools available for learners. Web 2.0, which ushered the era of content-creation, social media, and production (Google, YouTube, etc.) , following the dot-com crash in 2001, brought with it tremendous tools for learning. Now we’re beginning to see the impact Web 3.0, which empowers users to re-create, mix, transform, and produce new forms of information (Mozilla, Tagxedo, etc.).
Students now have the ability not to just be consumers of the web, but to be producers. There are numerous sites and applications that invite students to collect web parts, information, graphics, and media and mix them together to create a new interpretation of that topic or idea (Glogster, Videolicious, etc.)
Today I’d like to share a site that is rather new to me but that is simple to use and grasp for students and teachers: Thinglink.com
A Thinglink is a visual representation of a topic that embeds pictures, graphics, sound, text, and links. A creator chooses an image as the background and then can link in web content, providing a digitally engaging and unique experience.
It’s quick and easy to register and create an account with the opportunity to link your Facebook or Twitter account for set up. Then, you begin by importing a picture from your hardrive, choosing from your Facebook albums, browsing Flickr’s public photo gallery, or providing a web address for photo.
You are able to share your creation through Google+, Edmodo, Facebook, Twitter, and many other social platforms or by the link, like here (Thinglink for the book Code Name Verity by Elizabeth Wein).
Thinglink is also available as a gadget for blog services. Check out the gadget on my blog on the upper-left hand corner!
Infographics: Going Digital with Data
Tech Tuesday: Students as Information Consumers and Creators
Our students are bombarded with information 24/7/365. They forget (never learned) how to be curious and critical consumers. An inquiry stance to learning taps into our natural curiosities, building upon content area knowledge in relevant and authentic ways. A simple infographic (informational graphic) might make more of a lasting impression upon a student and his learning experience than a five page research paper or report.
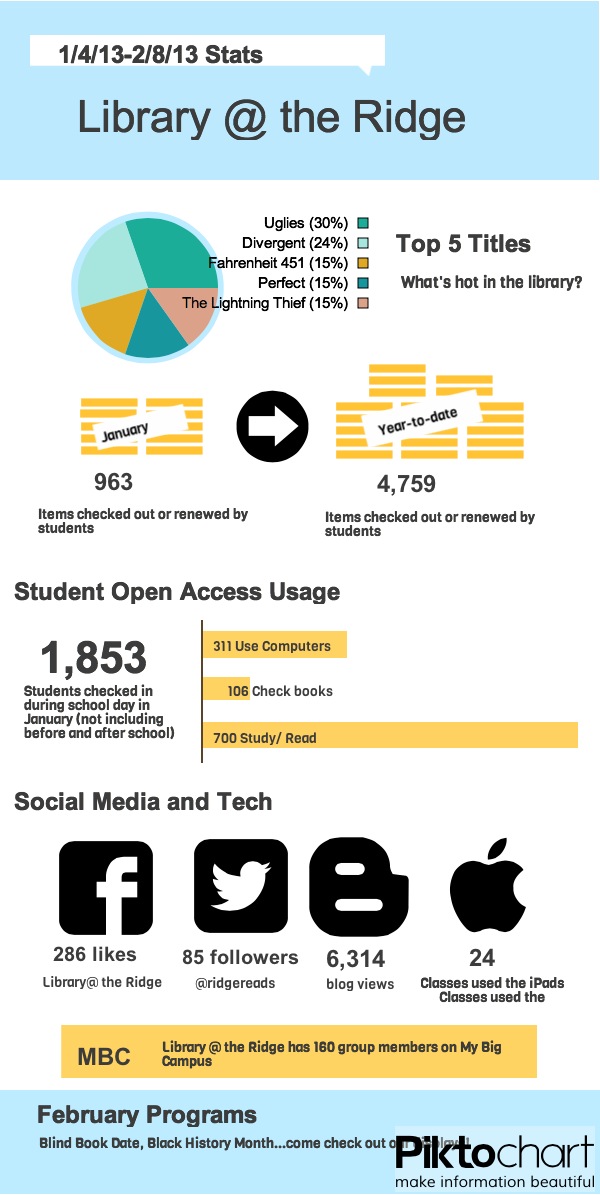
 |
| Created at http://www.piktochart.com to publish the library’s statistics for January |
American Association of School Librarians (AASL) NETS-S
Student Collaboration with Google Drive
1) One person does all the work. The high-achiever of the group grins and bears it as they carry the weight of the project.
From the other side of our various devices and locations strewn across the metroplex, we all shared a collective sigh and appreciation for the power of collaborative writing and tools such as Google Drive that breathe life and spirit in to the writing process.
So here’s the skinny on Google Drive:
1) It’s free. Doesn’t get any better than that.

Applications for learning:
Can we still have the same learning goals for students and their writing if they are participating in a collaborative essay or project that we would an individual assignment? YES! Do we address more learning goals by having them use technology to work collaboratively on a writing task? YES!
ISTE’s NETs for Students even address this skill as relevant and integral to today’s workforce and post-secondary environments:
| 2. | Communication and Collaboration | ||||||||
| Students use digital media and environments to communicate and work collaboratively, including at a distance, to support individual learning and contribute to the learning of others. Students: | |||||||||
|
Coming soon! My Big Campus allows you to integrate Google Drive as an application, much like it does Facebook and Twitter, which means that students can collaborate on Google Docs and more through one portal: MBC!
What is your personal experience with using Google Drive? Do you see any advantages for using it with students? Are there pitfalls or obstacles to integrating Google Drive into your learning activities?
On the Path to Technology Integration…We Need a Map
Great things are happening here at The Ridge! I’ve always believed that the leadership, innovation, and vision of individuals on this campus have the potential to make us leaders in education, especially in regards to raising student engagement and closing the achievement gap.
Recently, Fossil Ridge was awarded a KISD Education Foundation Grant. The project titled, “Closing the Gap” was the collaborative brainchild of a handful of these leaders.
The goals of the project are:
- Close the gap in access to technology that exists in our student population, allowing for equity to digital tools and resources and extending the school day to a 24/7 model.
- Investigate the role that technology has on learning.
- Inform the long-range vision for technology integration and strategic plan for our campus.
I am pleased that the community and district leaders recognize the efforts and leadership capacity on our campus and am thankful for the present and future support we will receive as we work towards these goals.
As discussions took place regarding deployment of our project, which involves selecting twenty AVID students to receive Dell tablets and Verizon mi-fi cards for use at home and at school, we all agreed that in order to truly understand how technology impacts learning. We needed to form a leadership team, who would engage in a PLC that explores theory, methods, and tools for educational technology. It’s not enough to simply provide students with access to technology. Even the largest 1:1 programs in schools, without a professional development plan for teachers, will not produce the impact on learning that designers anticipate.
This team will visit schools in the Metroplex who have adopted some kind of technology model (1:1, BYOD, etc.) and observe how their deployment model impacts learning, what type of systems are in place to support student and teacher integration of technology, and measures that can capture the data we need to inform our vision. In addition to field trips, the team will also meet regularly to share resources, explore models, and create lessons that integrate tools. But, it all has to come back to the same point: How does technology impact student engagement and learning?
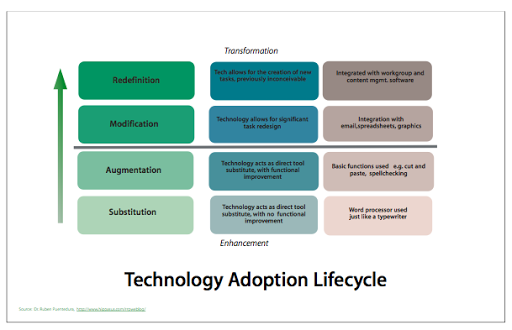
This past weekend I was explaining our project to another National Writing Project teacher consultant who is an instructional leader in a neighboring district that is exploring these same questions and working to support teachers as they grapple with technology that is integrated into instruction. She suggested that we start with the SAMR model developed by Dr Rueben Puentedura. Through this model, Dr. Puentedura demonstrates how our goal when considering a long-range technology adoption cycle on any scale, from district-level down to the classroom, should be to move from enhancement to transformation.

SAMR stands for substitution, augmentation, modification, and redefintion.Substitution: At this stage you are using technology as a direct substitution for another tool. Think using a word processor in lieu of a type writer without utilizing functions such as spell check, grammar check, etc. Dr. Puentedura argues that at this level, productivity actually decreases.
Augmentation: If we continue with our example of the word processor, then at this next level we would use its built-in features such as Spell Checker, word count, copy and paste, etc. Productivity or work flow might increase at this level, perhaps students can produce a finished draft more quickly using a word processor, but how has the tool transformed their thinking?
Notice the dotted line between the Augmentation and the next level in the model. This is meant as a target. When considering tools and tasks that integrate technology with learning, our goal should be to be above this line.
Modification: Again, if we consider the word processor as a tool, how could we modify the tool to allow for greater productivity? Rather than printing the file and sharing it, what if we integrated another tool such as email or drop boxes to publish and share? Or, what if we integrated a product or feature of another tool such as a chart from Excel, digital photos of artificats, etc. At this level, Dr. Puentedura claims, student learning begins to transform.
Redefinition: Here’s where my mind really starts to bend…In the redefinition level, technology allows us to do things otherwise impossible to create new products in new ways. Rather than a word processor where one student is authoring a product, what if students utilized Google Docs to collaborate in real time! This would not have been possible before. Students couldn’t work from their own houses from their own devices on a task at the same time. Now, technology allows for this level of collaboration and creation.
 |
| http://msdwc.edublogs.org/files/2010/04/itlog_techlifecycle1.png |
My colleague explained it to me much more simply…instead of old things in new ways, our goal is to shoot for new things in new ways.
I did some reflecting over some of the tools I’ve highlighted in the blog that meet this goal. Below you’ll find a list of tools and links to those blog posts that help us reach the Enhancement level of learning through technology.
Google Earth
My Big Campus
GoAnimate and Sock Puppets
Socrative
Glogster
VoiceThread
Prezi
I’m curious to hear your take-away after thinking about this model and how it applies to your decision making and lesson planning process. Limitations, drawbacks, confusions, applications? Leave your comment!
Tech Tuesday: Google Earth
Google Earth: More than “Miss, I can see my house!”
I remember when I first learned about Google Earth. My students and I were fascinated by typing in our street address and zoom in so we could distinguish the roof of our school and then even the fence line of our backyards! A view of our own little world and community from space provided us with a new perspective into how we related to the world around us.
When I was really on fire about Google Earth, I would pull it up, type in the name of a city or address or continent and display it for my classes to help them understand the geographical context of a story or author we were studying. This was high-tech stuff for me as an English teacher.
But, Google Earth goes far beyond “you are here.” Did you know that Google Earth has features such as push pins, narration, tours, recording, annotation, embedding media, and so much more?! Check out the video to see some of the basic features while navigating in Google Earth.
For a hands-on experience, go to Tour of Google Earth’s features.
Of course, Google Earth is much, much more than merely zooming in and out to find landmarks. Below is a list of popular tools in GE and how they can be used in the classroom (borrowed from Google Earth’s Education Resources):
Classroom Resources: Features for My Class
Fly to the Sky: With Sky in Google Earth your students can explore Hubble telescope images, check out current astronomical events, study the proportions of different planets, measure their size, and observe the relative brightness of stars. You’ll capture the wonder of the universe without leaving your classroom. Learn More! Easy
View Historical Imagery: With the timeslider, view historical imagery to study the construction process of large buildings such as sports stadiums. You can also see how communities have developed by comparing the city layout of past and present. Learn More! Easy
View 3D Buildings :With 3D buildings Google Earth students have entire city landscapes at their finger tips. They can explore specific skyscrapers, public landmarks, famous ancient architecture, and even study city planning techniques and trends. With Google SketchUp students can recreate entire ancient cities within Earth. Learn More! Average
Draw and Measure: Discover the world’s tallest building or the world’s highest mountain peak by using the ruler tool to measure skyscrapers and mountains. You can mark off specific regions you have studied, or want to come back to using the polygon tool. Learn More! Average
Create a Tour: Students can create customized tours to share with their classmates. For example, they can build context around a novel by creating a tour of all the places mentioned in the book. Or, they can make a tour to highlight all the major rain-forests effected by deforestation. Learn More! Average
Google does a terrific job supporting educators and integrating Google tools into instruction. If you are curious about how Google Earth could be incorporated into your content area, check out the Projects for My Subject page.
Google Lit Trips
As an English teacher and librarian, I am particularly excited about Google Lit Trips! Teachers and students can browse the many Google Lit Trip tours already created to explore the geographical locations and landmarks in their favorite stories.
Here is a tour featuring the mythological and present day locations of The Odyssey. To view the tour, you will first need to download Google Earth and then download the kmz (Google Earth extension file name) for The Odyssey. Trust me–it is well worth the two clicks it takes to view it! The tour includes a 3D map of the locations along Odysseus’ journey, excerpts from the epic, photos, tour guides with facts and further details about each landmark, and more!
Not only can teachers and students browse the many Lit Trips already created, but they can create them as well for their favorite stories! For more video tutorials on creating Google Lit Trips check out YouTube and Vimeo!
Google Earth is also available as an app for a smart device, allowing students to view and create projects using their personal devices. Perhaps a Google Lit Trip or similar resource might make for a great Flipped classroom introduction or “View” in VESTED!
So let’s hear it! How could Google Earth be used in your content area?
Tech Tuesday: The Flipped Classroom
Tech Tuesday: The Flipped Classroom
(heads-up to the new buzz word coming down the pipe)
Are you flippin’ kidding me?! Yet another buzz-word, topic of discussion for faculty meetings, initiatives, seeds, pilots…they just never end do they 🙂 Nor should they!
I, too, tired of the endless onslaught of programs, anachronisms, and pilots, but let’s keep some perspective and remember that the business of education cannot become static. It is in our best interest to continue reflecting, examining, and being critical of the practices and tools we bring to our students. Do they truly represent the demands and learning styles of a digitally-savvy generation?
Today I present you with a little nugget of an idea that a few of you have already started to nibble at: the flipped classroom.
Here’s some food for thought:

Don’t you just love infographics?! They make blogging so easy 🙂
Is this idea entirely revolutionary and unique? No, there are many other names and variations out there (front-loading, anticipation guides, schema theory, VESTED). What might be novel to some folks is the idea of employing technology as a tool to do these things. The infographic touts some impressive (and hard-to-believe) statistics for one flipped school. I’d be very curious to see this tried in one class for one week. My Big Campus is a terrific fit for this approach with the extensive Library resources, ability to upload YouTube videos, and learning tools such as discussions, chats, and assignment.
Heck, I’ll even pitch in and help gather resources and organize the content into MBC! Take me up on it, seriously, let’s see what happens just for one week…
For dessert, visit Khan Academy, and take a little test drive for some possible videos you could use as part of a flip:
http://www.khanacademy.org/
I even grabbed one for the electoral college to re-post just to tickle your taste buds…
Tech Tuesday: My Big Campus

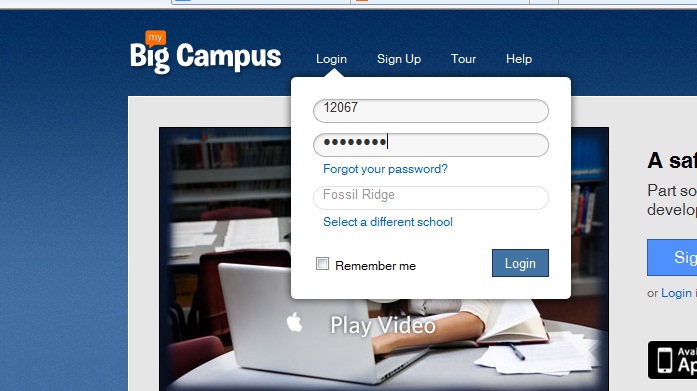
Tech Tuesday: My Big Campus, a safe online classroom platform
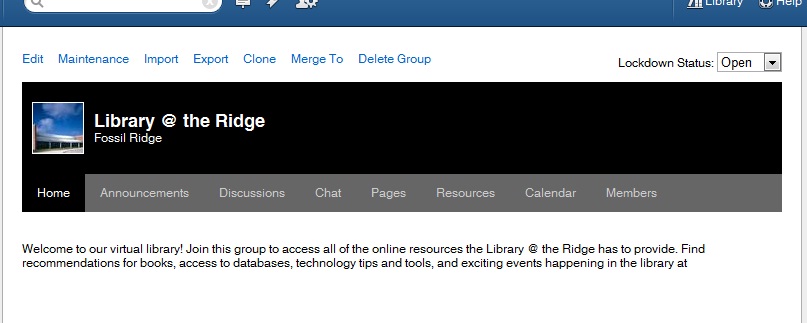
 Groups–Getting started is easy-peasy! Teachers and students are already registered. In fact, when you click on your groups, you will see each class period and subject already organized into groups.Students will see each of their classes as well. Click on a group to enter the online classroom for that class period.
“Right now, I am loving the calendar feature. Each morning I put our physics plan for the day on the calendar and in the description portion I let the students that are absent know what they will need to do in order to make-up their missing work for the day. I no longer have to answer the dreaded question “I was absent yesterday, did I miss anything?” ~ Camren Robinson
Both students and teachers can maintain a blog through MBC. Blogs allow for a personalized platform to reflect on learning in any content area.
One of the most useful features in MBC is the Library. Teachers can search for content that has been uploaded into bundles to pull into a bundle for their class. They can also upload additional content and share with team members.
Tech Tuesday: Apps for Animation
Tech Tuesday: GoAnimate and Sock Puppets

 I’ve asked Madame Morgan to be my guest on the blog this week, and she graciously accepted.
 Why did you choose GoAnimate and Sock Puppets?
What obstacles, limitations, or surprises did you encounter?
What are the benefits to using applications and web 2.0 tools for animation?
- engages students in the learning process as they synthesize content into a digital story
- supports collaboration between students through the writing process: brainstorming, story-boarding, drafting, revising, publishing
- a task with an identified audience of their peers, other students, YouTube, etc. provides relevance along with rigor
We’d love to hear your thoughts regarding possible extensions and adaptations of this project in your content area! Feel free to leave any questions or thoughts for Mme. Morgan as well.
